


Trend trading is considered to be the safest and easiest way to make money on Forex. Prior to opening a trade, you should correctly determine market entry and exit points. To find these points, you should have extensive knowledge and solid trading experience. The Pattern Graphix plug-in, specifically designed for clients of brokerage firms, will enable you to trade on Forex without the needed knowledge and experience. Developers of Pattern Graphix implemented one of the most effective ways of trend trading in the plug-in, which includes the price chart analysis for trend continuation patterns.
This approach has proved popular because continuation patterns are a special case of the wave analysis based on market psychology.
Let’s consider one of the liquid assets. If the market is dominated by buyers, it begins to grow until
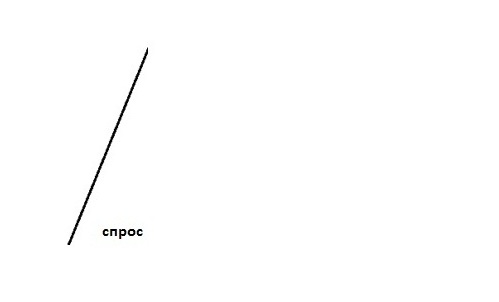
*demand
the majority of market participants starts to close their positions.
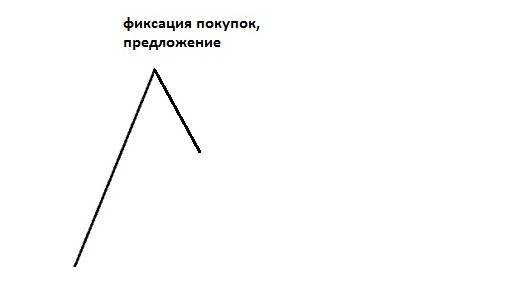
*closing of buy orders
supply
As a result, there is a price correction to the levels where the demand for an asset appears again.
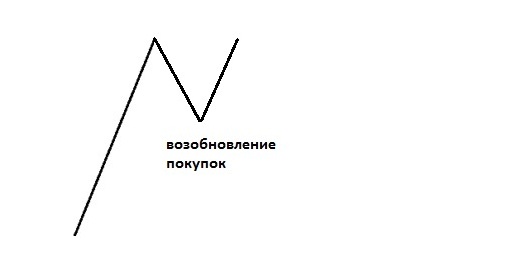
*renewal of buy positions
The growth continues until market participants begin to close their buy positions again and resume sell trades.
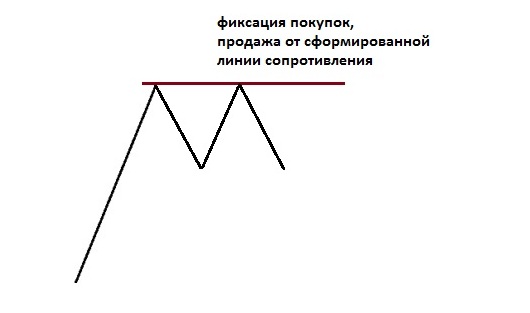
*closing of buy positions, selling from the formed resistance line
Alternation of supply and demand in a narrow price range is called the flat market, which looks like one of the graphical analysis patterns. After the price action has left the boundaries of consolidation, the pattern is considered to be fully formed.
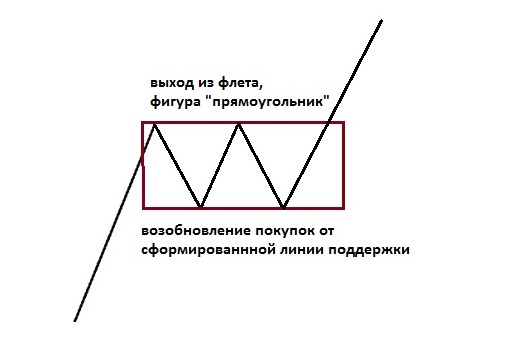
* Leaving flat market, rectangle pattern,
renewal of buy positions from the formed support line
Trend continuation patterns are considered to be the ones that have a breakthrough in the direction of the primary trend.
Pattern Graphix will help you to timely identify a trend continuation pattern and to calculate the parameters of a trade depending on its type.
Pattern Graphix identifies the top eight most common trend continuation patterns. They are: symmetrical triangles, rectangles, pennants and flags.
Given that the bullish and bearish patterns are merely the mirror reflection of each other, we will consider only four patterns.
Flag
The bearish flag pattern is formed amid a strong downtrend during a short pause. It resembles a small parallelogram tilted upward.
As a rule, price moving beyond the lower limit of the bearish flag means continuation of a downtrend.
After the trend weakening of the pound against the dollar, consolidation took the form of the bearish flag. Pattern Graphix successfully identifies similar patterns and informs you about them, showing recommended parameters of the trade.
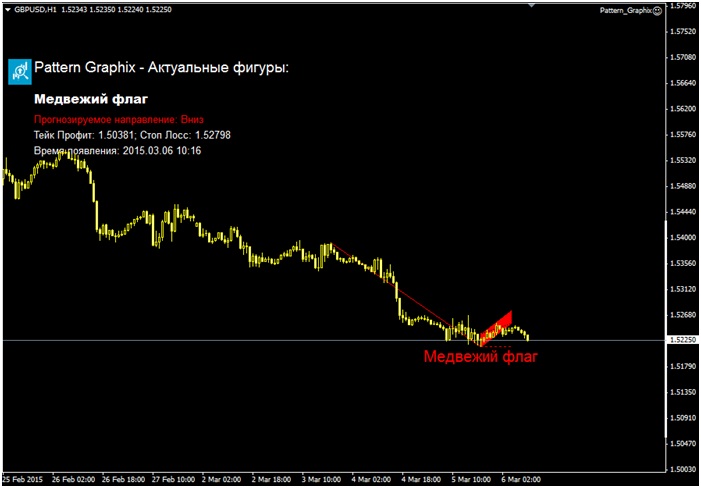
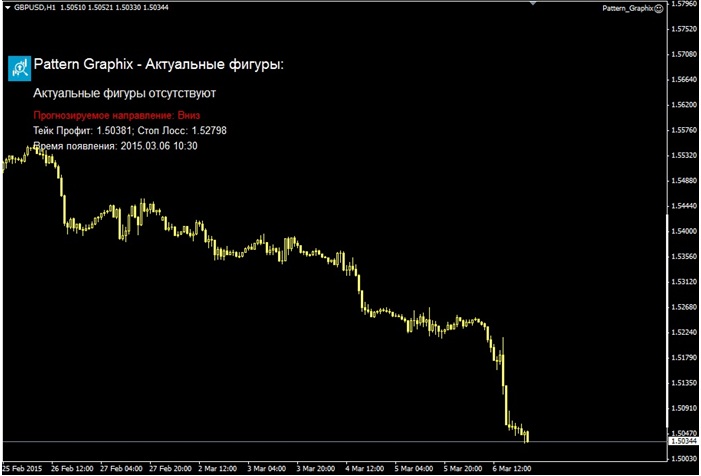
All you need to do is just choose the position’s volume, enter the market and wait until price hits one of the projected closing levels. In our case, the forecast has been successfully worked out and profit on the trade came in at 185 pips.
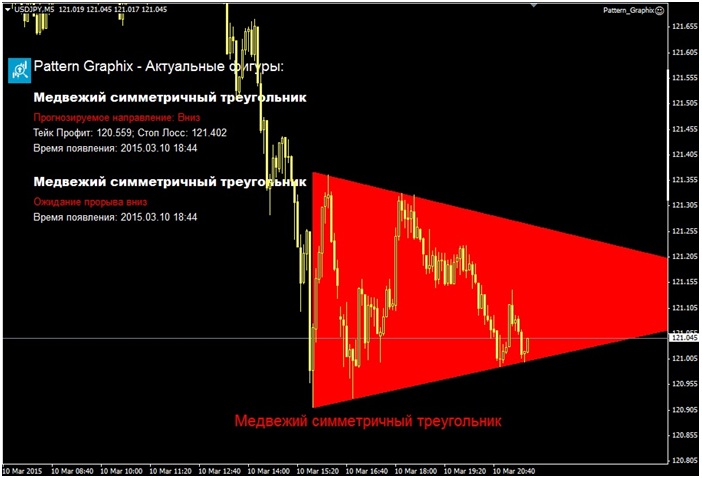
Symmetrical triangle
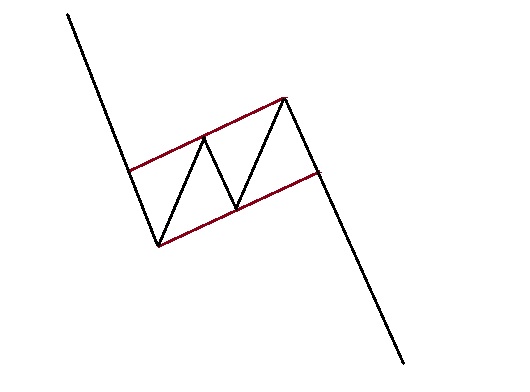
The bearish symmetrical triangle is formed when a downtrend begins to weaken. The oscillation amplitude reduces inside the triangle. Its upper and lower limits are the parts of an isosceles triangle.
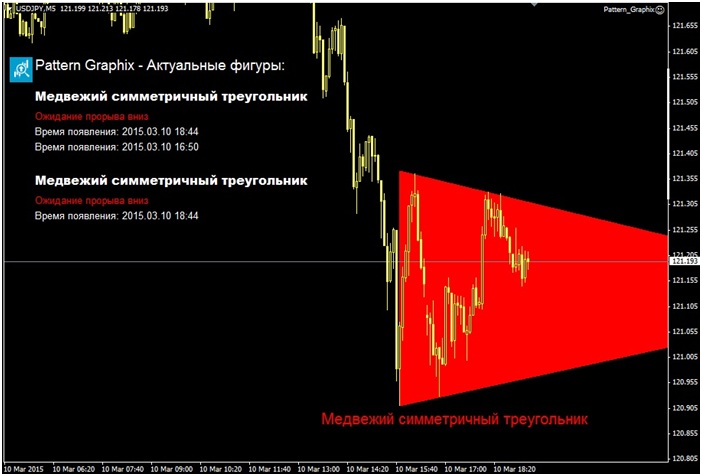
In most cases, a currency’s price hits its lower limit after the formation of the descending symmetrical triangle. The breakout means the continuation of a downtrend. The breakout of the triangle’s upper limit means the cancellation of the pattern.
Rectangle
The bullish rectangle is formed when the market is in an uptrend and the price is consolidating before continuing an upward movement.
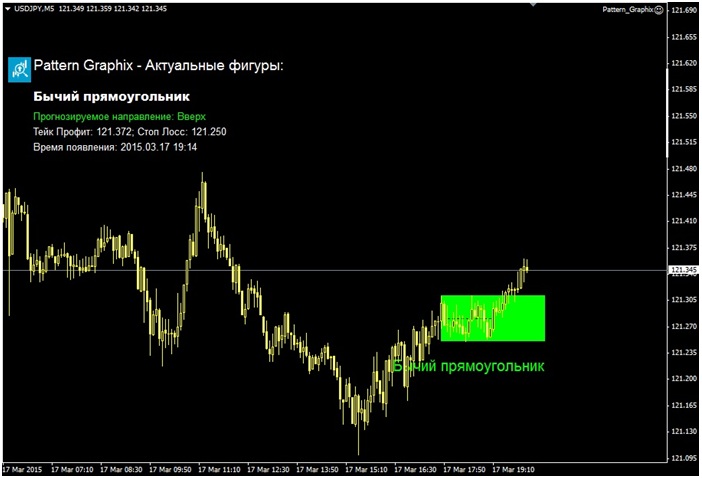
A breakout of the upper limit of such a rectangle means continuation of an uptrend.
Meanwhile, a breakout of the lower limit means cancellation of the bullish rectangle.
Pennant
A pennant emerges prior to a sharp price movement in the form of almost a straight vertical line, followed by a considerable trading volume. Then comes the phase of consolidation which results in the formation of this pattern.
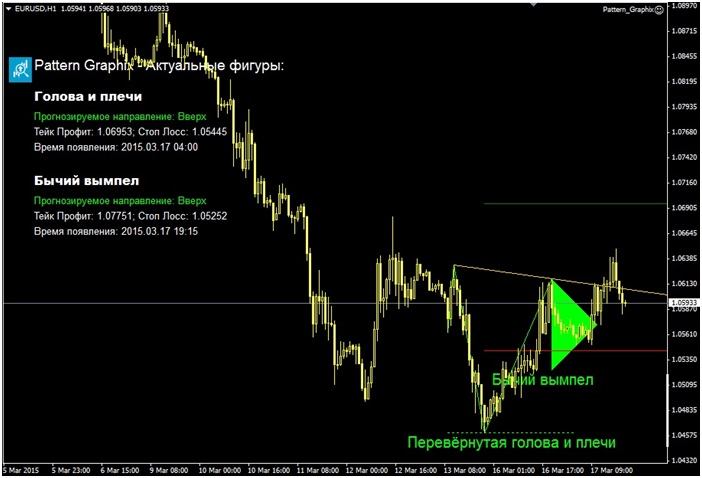
The bullish pennant is formed amid a strong uptrend in the moment of a short pause. It resembles a small symmetrical triangle.
As a rule, price moving beyond the upper limit of the bullish pennant means continuation of an uptrend.
Pattern Graphix will inform you about any of the patterns described and will show the recommended levels of support and resistance to open a trade. In case several graphical analysis patterns are formed on the same time frame, the probability of the forecast increases.
You can get signals about the patterns’ formation even when you are not using the platform. This option is available in the menu of notification settings.
You can download the latest version of the plug-in on InstaForex website, following this link.
Was this useful? Share or recommend if you think so!