Start trading with
no risks and investments
With new Start-Up Bonus of $1000
Get bonus
55%
from InstaForex
on every deposit
Earn up to
$50000
for inviting friends to get StartUp Bonus from InstaForex
No investments required!
$1000
No deposit bonus
Registration in 15 seconds without verification
Automatic bonus charging
Get bonus

Indicators and signals

The best indicators for profitable and sucessful Forex trading. All the indicators are free and available for downloading without registration on the website. Here you can find both standard and utilitarian indicators which will ease daily trading on the market. Based on Forex indicators represented in this section you can create your own profitable trading system. But don't forget that even the most accurate indicator can't give you 100% guarantee of successful trading.

EUR/NZD. TF H4, 17.03.2017. - Double Top
Published 17.03.2017 at 11.35 AM.

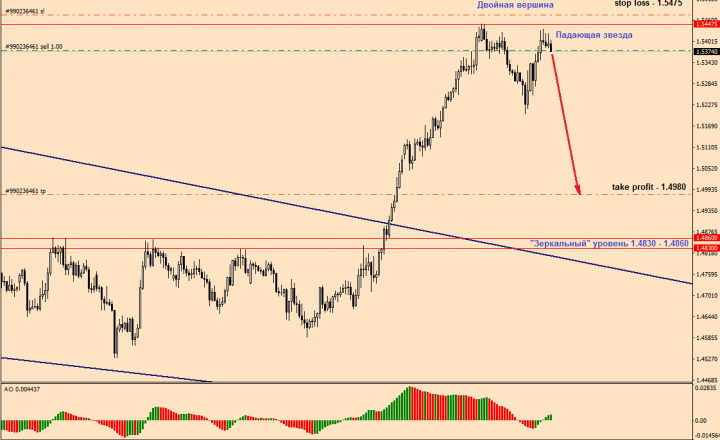
It is likely that continuous uptrend of the EUR/NZD pair is at the final stage and I expect to see the pair start falling today.I forecast further price movements with the help of technical analysis tools. In this case, chart and candlestick patterns were used. The four-hour time frame showed:

the Double Top pattern

the Shooting Star candlestick pattern which is located at the second top

EUR/JPY and EUR/NZD extend their gains
Published 03.03.2017 at 05.08 PM.

The EUR/JPY and EUR/NZD pairs have finally started moving in accordance with my expectations which I presented last month. These trading instruments have formed reversal patterns that have been developing successfully over the last few days. If you had enough patience to keep trades on these pairs open, then it’s time for you to reap a decent profit. At the same time, there were some unlucky fellows, like me, who managed to lock only small gains or whose trades were closed by stop loss orders. So, let me show you what price levels I’m going to use to enter the market again.

Trading advice for USD/CHF and EUR/JPY (22.02.2017)
Published 22.02.2017 at 05.42 PM.

Dear colleagues, I hasten to tell you my forecast for the further movements of USD/CHF and EUR/JPY pairs:

USD/CHF – the Bearish Wolfe wave was formed on the four-hour time frame. It will cause a short-term weakening of the US dollar against the Swiss franc;

EUR/JPY – consolidation shaped the Wedge. Currently, the price is near the support level at 118.70; any breach will lead to a mid-term rise of the euro against the yen.

EUR/USD. H1-D1, 16.02.2017, Inverse head and shoulders pattern
Published 16.02.2017 at 11.00 AM.

The euro/US dollar currency pair is likely to end its downward movement and grow in the medium term:

H1 – formation of an entry bullish wave H1 – break through the upper limit of the downward line D1 – the price retreated from the left shoulder level of the Inverse head and shoulders pattern D1 – formation of the reverse candlestick pattern Bull Hammer.

The formation data as well as relevant levels of support/resistance are shown on the charts below.

EUR/NZD. H4-W1, 13.02.2017. - Wedge pattern
Published 13.02.2017 at 12.10 PM.

While major currency pairs choose what direction to take, let’s have a closer look at EUR/NZD. What is so special about this pair? The thing is, this trading instrument is in the phase of continuous consolidation that is reflected by the Wedge pattern. Perhaps, you know better than me that rapid development of the pattern can bring decent profits. By the way, the last target level is 1,800 pips above the current price according to this pattern. That’s quite tempting, isn’t it? So let’s look at the EUR/NZD chart with different time frames.

CL (light oil). TF H4-D1, 07.02.2017. - The figure "Head and shoulders"
Published 07.02.2017 at 05.35 PM.

Crude oil prices (#CL) decline for the second consecutive day and the bearish sentiment starts to dominate the market. In particular, I expect oil prices to continue to fall within the Wedge pattern (Н4), which is the right shoulder of the Head and shoulders pattern (D1). If oil price is in line with forecast, crude will weaken by 8-10 percent during the next couple of weeks. Therefore, I offer you to seize the moment and try to make “a couple of bucks”.

So, what do we have today?

USD/JPY. H4, 05.12.2016 — Three Indians pattern formation
Published 05.12.2016 at 09.25 AM.

Good morning, my dear readers. And it is a good morning indeed not only for me, but for all those who followed my advice last week and placed a sell trade on EUR/JPY after applying the Three Indians pattern. A few hours after the market had opened, the take-profit order set at the last price level was executed, and the trade was closed with a gain of 250 pips.

The formation and implementation of the setup are strikingly technical, so I think that they are worth entering in the indispensable guide to forex trading.

Waiting for further movement of natural gas (#NG) and light crude oil (#CL) prices
Published 24.10.2016 at 10.17 AM.

Last week, natural gas (#NG) reached the targeted take profit level (3.05) that was calculated in strict compliance with the rules of the Head and Shoulders pattern we can see on the H1 chart. Partial closure of the bullish stop orders below the local low of 3.16 gave an opportunity to the bears to continue pushing prices for gas lower and lower. As we chose the direction of future trading, and now, we need to be exact with the entry and exit points.

EUR/USD. H1-H4, 20.10.2016 – Wedge Pattern
Published 20.10.2016 at 12.15 PM.

Some key economic events are expectedtoday that can have a significant impact on the EUR/USD pair.

14:45 – ECB deposit rate decision;  14:45 – ECB key rate decision; 15:30 – US initial jobless claims; 15:30 – ECB press conference.

Traders who try to avoid high volatility are recommended to stand aside and watch the developments. But those who feel at home in the volatile market should attempt to foresee further movement of the euro/dollar pair with the help of technical analysis. Today we are going to apply patterns, levels, candlestick reversal patterns, and bullish divergences. 

USD/CAD D1, 10.10.2016 – Bearish Wolfe wave
Published 10.10.2016 at 05.28 PM.

Today the USD/CAD pair finally started declining within the Bearish Wolfe wave on daily time frames and the Wedge reversal pattern on the four-hour time frame. On Friday, a sell deal was opened, but due to a slight over-high I had to correct targeted take profit levels. After reading the post, you’ll find out how you can blend different time intervals and patterns for more accurate market entry and for lowering the stop loss level.