


It is no secret that trading practitioners, in addition to performing market analysis based on their own strategies, often look through analytical materials published by fellow traders. They do so not because they don’t feel confident about their own approaches but rather to ensure that the process of professional development never stops. Among hundreds of charts, one will always find a new idea that can be turned into a profitable trading system. Oh no, don’t worry, I’m not going to write here about holy grails.  This time, I’d like to talk about trend lines and ways to draw them correctly on a chart. You may ask, “Is there really a way to draw them incorrectly?” Believe it or not, some traders, even those who have spent years trading on Forex, still haven’t learned how to build correct trend lines, though they may believe they have mastered the art.
To begin with, let’s recall what a trend is.
Trend is a tendency of prices to move in a particular direction over time.
In an uptrend, the price is moving upwards, with each consecutive high above the previous high and each consecutive low higher than the prior low.
In a downtrend, the price is moving downwards, with each consecutive low below the previous low and each consecutive high lower than the prior high.
Therefore, trend lines are drawn according to price dips in an uptrend and to price peaks in a downtrend.
Below are the conditions that you should follow to build trend lines correctly in a downtrend.
- There should be at least two local highs and two lows on the price chart.
- The high at point 3 should be lower than the high at point 1. The low at point 4 should be lower than the low at point 2.
- After the price breaks the trend line, we don’t take it away from the chart until a new local low is in place. Untilthen, abreakoutisconsideredtobevalid. After the price finds a new local low, the breakout is viewed as false.
- After the price breaks the trend line and finds a lower low, the old trend line should be removed from the chart and replaced with a new line.
I’d like to illustrate the last condition with an example:
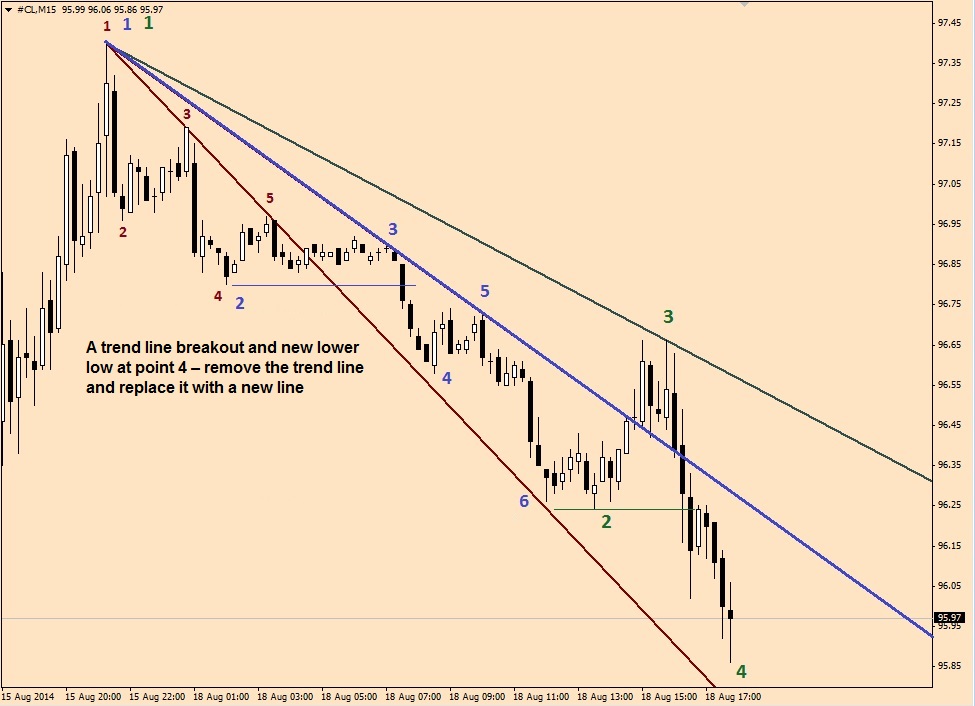
At first, we built a red trend line as it met the condition for a sequence of highs and lows. At point 5, the trend line was broken, but the price found a new local low. Therefore we had to remove the red trend line from the chart and draw a purple line instead. So the key points of local highs and lows were also changed. Then the purple line was replaced with a dark green trend line.
In these examples, most traders would not probably make any mistakes.
Trend lines are often drawn incorrectly when the price breaks out of a trend line by just a few pips. Some traders usually ignore such small breakouts and continue trading with old lines on a chart. As a result, they fail to determine actual rebound/breakout levels and lose their money.
I hope this post will help you avoid such “childish” mistakes when trading on Forex.