


To give a close outlook on a trading instrument, one should know the aspects of working in MetaTrader4. That’s why during this lesson we’ll deal with the following features:
- how to zoom a chart;
- how to shift space from the price extremes to upper and lower window edges;
- how to set a custom vertical position of a chart;
1. How to zoom a chart
Firstly, you should shift time frame from long to a shorter one. For example, you analyze an H4 chart and want to see the structure of an upward wave in more detail. In this case you need to change time frame to H1 or M30. To do so, click the corresponding button on the upper frame of the platform:

Secondly, you can zoom in or out the candles on a chart. This option can become necessary if:
- you want to set a given time frame of a price movement. Depending on a desirable frame, press Zoom In or Zoom out;
- your monitor is quite big, and it's hard to see the price structure from a long distance. Accordingly, to make candles bigger, press Zoom In.

2. How to shift space from the price extremes to upper or lower window edges
Let’s suppose that the price moves within the firm trend, and to set the take profit order, you need to see beyond the window edges. To do so, move a cursor to the vertical scale, and you’ll see the corresponding text box. Holding the left mouse button, move the cursor down. If you do it in a proper way, then the space from the upper and lower window edges will simultaneously increase.
3. How to set a custom vertical position of a chart
As the developers have hid this option, to set a random price range, you need to do the following.
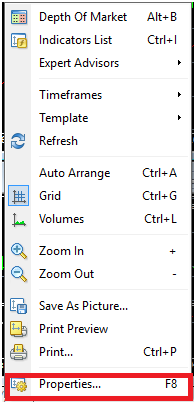
- Press F8 or click right mouse button on a desktop window and choose Properties
-
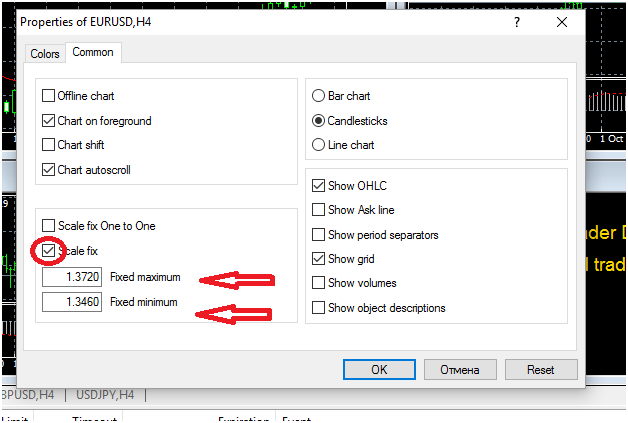
Tick Scale fix In the Common tab and fill in the custom figures in the corresponding fields.
-
Press OK to save the changes. As a result, the space from the upper edge will be increased and you’ll be able to define the level for profit taking.
Now, being able to change the scale and position of a chart on a desktop window, you can give more accurate forecasts and improve your trading results. 