


Dear friends, today we continue to talk about the Fibonacci Retracement. In this lesson we will explore the trend trading technique that requires application of this tool. As early as in the beginning of the 20th century, Jesse Livermore said that “prices are never too high for you to begin buying or too low to begin selling.” We all saw how this statement came true over the past few weeks in GBP/USD chart. But do not forget that any trend ends sooner or later. Therefore, if you do not want to turn from a speculator into a long-term investor, you should observe the rules of money and risk management in trend-following techniques.
Trend trading with the Fibonacci Retracement
Apart from the Fibonacci Retracement, we will also need the Bill Williams's Awesome Oscillator Technical Indicator (AO) that will help us determine the beginning and the end of the current wave. In trend trading the retracements are usually not deep, so we will enter the market using the following orders: buy stop, sell stop.
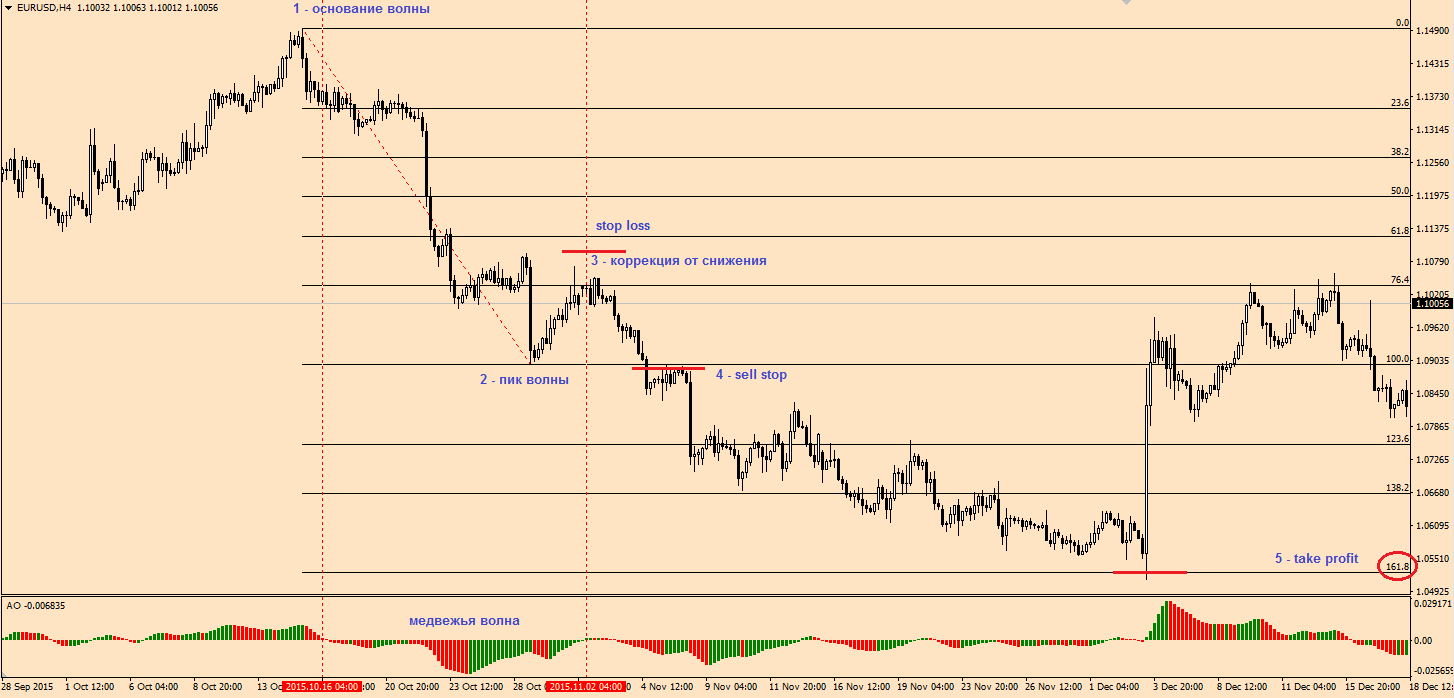
Algorithm to start sales in a bearish market:
1. Identify a downtrend. Remember, each subsequent local minimum should be lower than the previous one, and each local maximum must be lower than the previous one.
2. Use the AO indicator to define the extremes of the bearish wave. The wave base (p.1) is at the highest point that precedes crossing of the indicator and the zero line (vertical dashed line). In a similar way, we find the wave peak (p.2).
3. Wait for the completion of the correction. One of the signs is the crossing of the AO indicator and the zero line.
4. Place the delayed order five points below the wave peak. Then place the stop loss several points over the correction extreme.
5. Place take profit at 161.8% Fibonacci line.
In a similar way, look for purchases in a bull market.
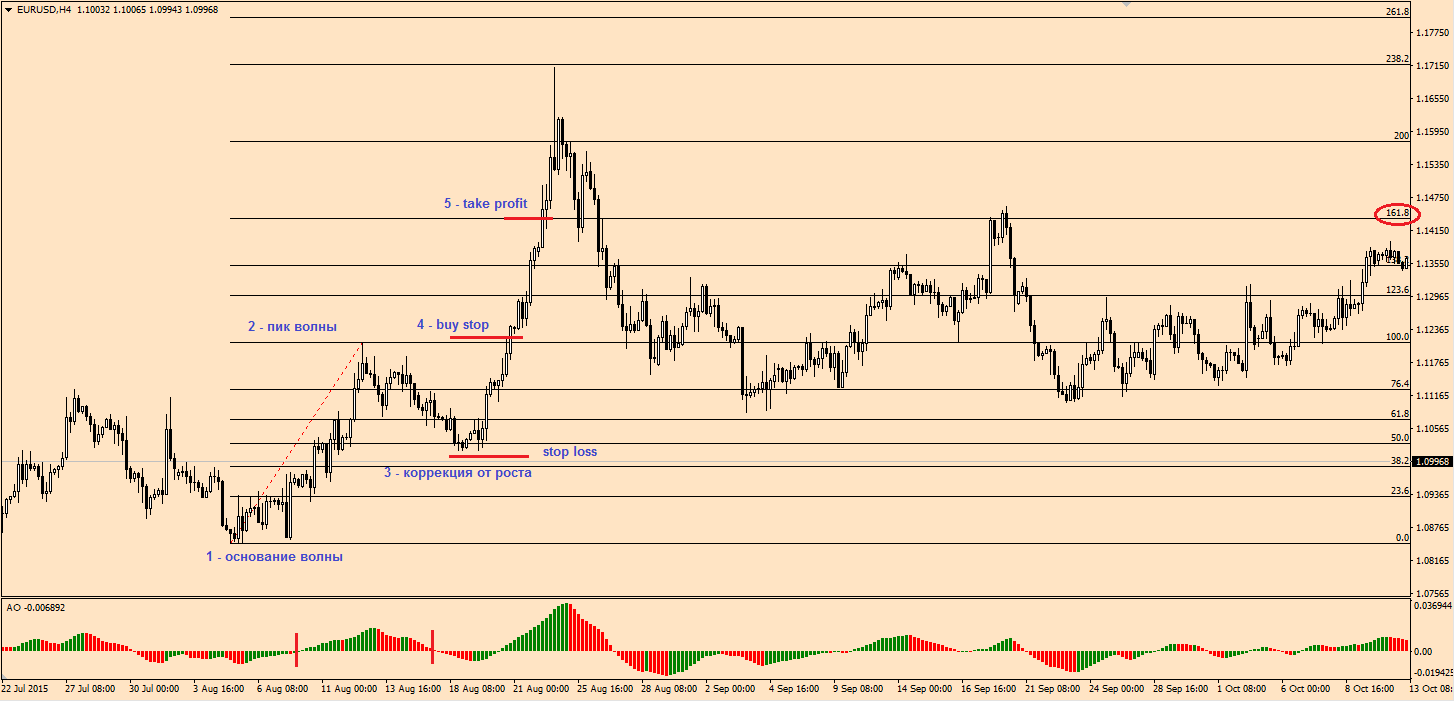
Algorithm to start sales in a bullish market:
1. Identify an uptrend.
2. Use the AO indicator to define extremes of the bullish wave. The wave base (p.1) is at the lowest point that precedes crossing of the indicator and the zero line (vertical dashed line). In a similar way, we find the wave peak (p.2).
3. Wait for the completion of the correction. One of the signs is the crossing of the AO indicator and the zero line.
4. Place the delayed order five points over the wave peak. Then place stop loss several points below the correction low.
5. Place take profit at 161.8% Fibonacci line.
In the next lesson I will show you how to determine the entry points using the Fibonacci Retracement during countertrend trading.