


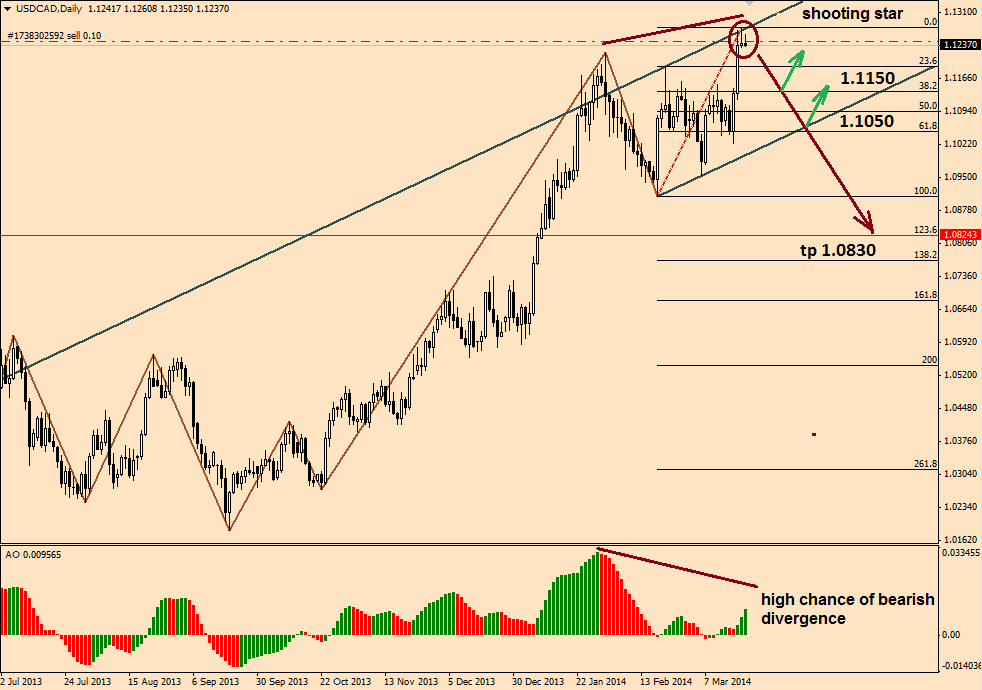
On March 21, 2014, a bearish setup was formed on the USD/CAD chart. Let’s have a look at the currency pair movement on Н1-D1 time frames. First, we are going to deal with a daily chart. We can see a shooting star pattern formed in the upward trend. This pattern doesn’t require confirmation. I’d recommend entering the market at the open of a new candle with stop loss above the star tail. At best, a bearish divergence would be formed that can give the price momentum to break the channel and target the 1.0830 level.
Support levels are specified on the chart below.
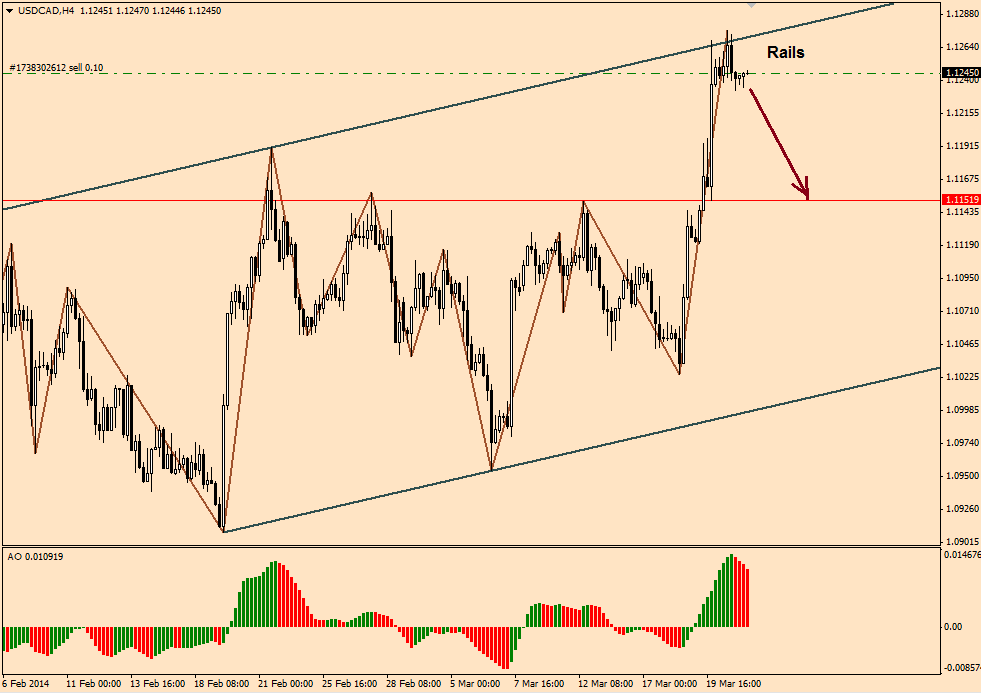
Н4 time frame. A rails pattern has been formed around the higher boundary of the upper channel. The target level is located at 1.1150, which is resistance turned into support.
H1 time frame. A head and shoulders pattern has been formed. Currently, the price is testing the neckline. The target level coincides with the one on the H4 time frame.
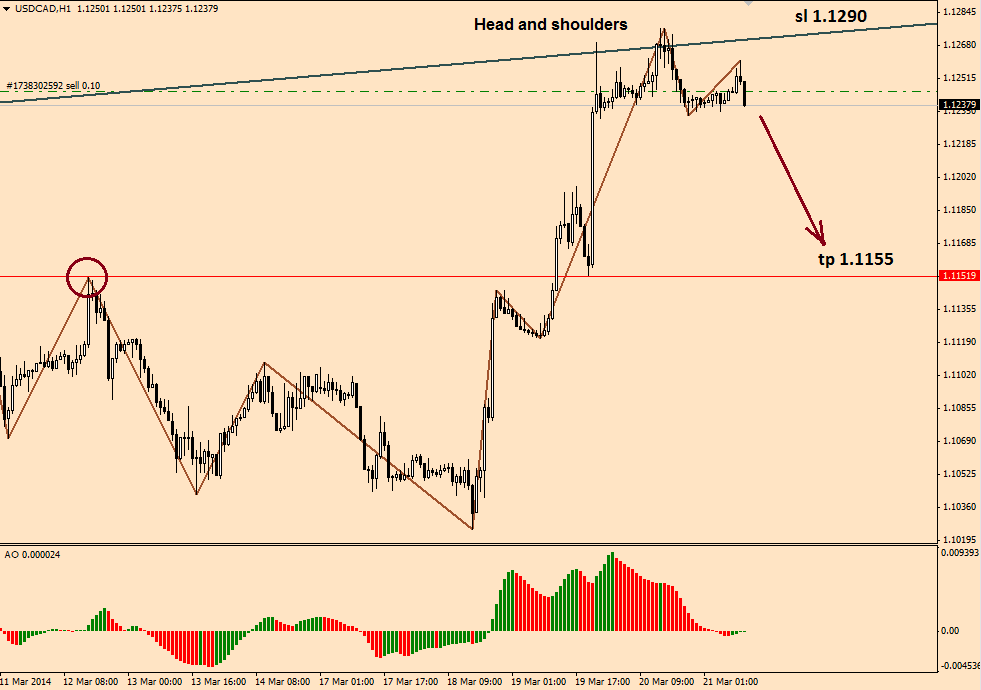
Based on the above-mentioned, I’d recommend going short on the USD/CAD pair with a stop loss at 1.1290 and the following target levels:
tp_1 1.1155;
tp_2 1.1050;
tp_3 1.0850.
Good luck in trading!