Start trading with
no risks and investments
With new Start-Up Bonus of $1000
Get bonus
55%
from InstaForex
on every deposit
Earn up to
$50000
for inviting friends to get StartUp Bonus from InstaForex
No investments required!
$1000
No deposit bonus
Registration in 15 seconds without verification
Automatic bonus charging
Get bonus

Indicators and signals

The best indicators for profitable and sucessful Forex trading. All the indicators are free and available for downloading without registration on the website. Here you can find both standard and utilitarian indicators which will ease daily trading on the market. Based on Forex indicators represented in this section you can create your own profitable trading system. But don't forget that even the most accurate indicator can't give you 100% guarantee of successful trading.

GBP/USD: Н4-D1 time frame (mid-term), April 18, 2014
Published 18.04.2014 at 12.01 PM.

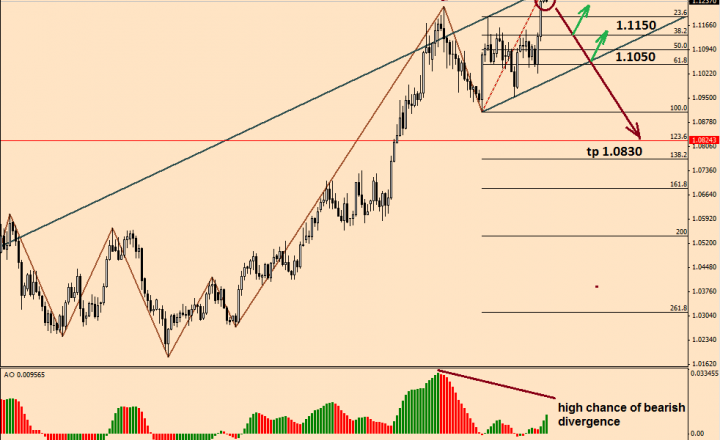
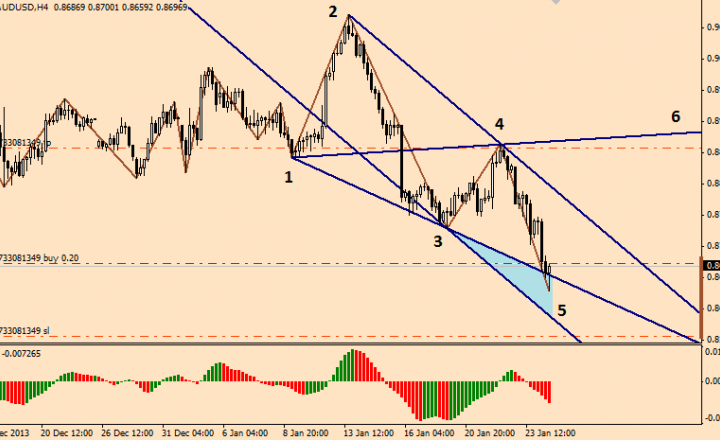
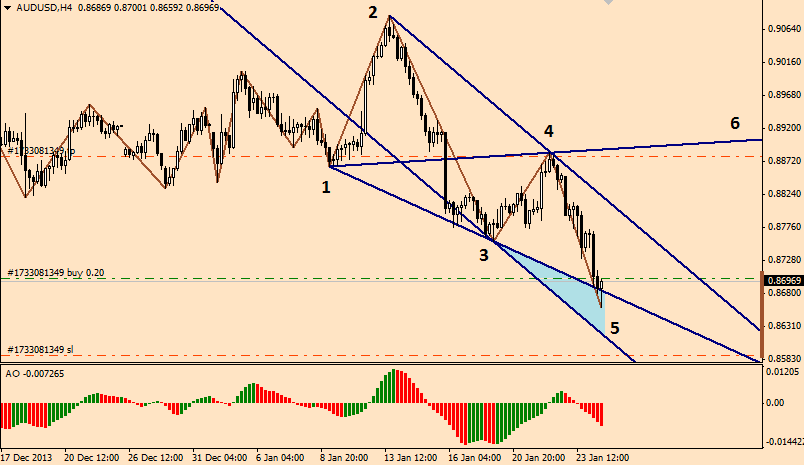
It seems that the upward move of the GBP/USD pair is coming to an end, so now it is time to look for market entry points for mid-term shorts. At the moment, trend reversal patterns are starting to form on the timeframes of H4-D1.

Н4 time frame:

• Bearish divergence;

• A falling Shooting Star at the highest level confirmed by the second bearish candlestick with its body exceeding over 50% of the bullish candle body (before the Shooting Star).

USD/CAD. H1-D1 time frame, March 21, 2014
Published 21.03.2014 at 12.00 PM.

On March 21, 2014, a bearish setup was formed on the USD/CAD chart. Let’s have a look at the currency pair movement on Н1-D1 time frames. First, we are going to deal with a daily chart. We can see a shooting star pattern formed in the upward trend. This pattern doesn’t require confirmation. I’d recommend entering the market at the open of a new candle with stop loss above the star tail. At best, a bearish divergence would be formed that can give the price momentum to break the channel and target the 1.0830 level.

EUR/USD. ТF H1, 14.03.14.
Published 14.03.2014 at 07.41 PM.

Dear friends,

If anyone hasn't sold euro yesterday, he can do it today. After the falling this pair rolled back to 76,4%. On ТF Н1 a candle model “falling star” has been formed. I recommend to open sell orders on market price. Stop loss at 1,4100.

The goal for sales - 1,3650 (probably it will be corrected).

I think that on Н1 there's a good opportunity for the 3rd wave developing.

EUR/USD. D1 time frame (mid-term), March 13, 2014
Published 13.03.2014 at 07.41 PM.

With reference to the previous forecast on March 11, the price reached the take-profit level at 1.3960. At the time of writing, an entry point for short selling occurred in the H1 time frame):

-  a candlestick pattern called the railway track;

-  bearish divergence.

I’d also like to mention that in daily charts we can find the formation of the bearish Wolfe wave pattern. Now the price is located around Point 5. Pay attention that we deal with a narrow sweet zone and cannot place a short stop loss order.

Forex trading signals
Published 04.02.2014 at 11.17 PM.

Hello dear traders!

In this section I will publish trading signals and also my vision about the moving of currency pairs, oil and metals. Here you won't see two-side arrows used by many analysts. In my opinion signal must be unique with exact take profit & stop loss levels.

The minimum time frame used in trading is М30. I prefer the Н4 time frame. Thus you will have enough time to open a trade.

May the profit be with you! 

EUR/USD, 30M TF
Published 03.02.2014 at 04.40 PM.

Hello dear traders.

The Bucket and Rails patterns were formed on the EUR/USD pair in the 30-minute time frame. It is recommended to open long positions with a stop order at the 1.3470 level (5 pips below the low) and take profit, at 1.3542 (161.8% Fibonacci extension).

The signal has the following disadvantages:

- trading against the trend in the 4-hour time frame;

- short-term entry in the direction opposite to the forecasts for higher time frames (D1 & W1);

EUR/JPY. TF H1, 28.01.14
Published 28.01.2014 at 01.30 PM.

On EUR/JPY we have a bearish Wulfe wave on ТF Н1. Currently the price has come out of the sweet zone and goes to 2-4 line. I recommend to enter in short positions from current ones and it's better to transfer short positions to break-even while tested 2-4.

Stop loss levels:

sl_1 - 141.05;

sl_2 - 141.50

AUD/USD. ТF H4, 24.01.14.
Published 24.01.2014 at 03.00 PM.

On AUD/USD at Н4 the Wulfe bearish wave is formed. The price has come out of the sweet zone which is the signal for long positions opening.

You can place stop loss both under 0.8950 and sweet zone 0.8590. On this chart you can see stop loss under sweet zone.

Because the 6th point is only 20 pips higher than 4thtake profit is placed on 4th point's level.

Gold
Published 14.01.2014 at 09.00 AM.

This night, a two-week New Year’s marathon has been completed. Firework displays are over. Kids are back to school. It’s time that we resumed trading.

Let me introduce you to the intraday Wolf waves for gold. I’ve been closely monitoring this pattern since December 2013.

Last week, during the thin market the price managed to leave the sweet zone. To enter the market, you are recommended to wait until the breakout of the resistance level of $1,267, which is found at the crossing point of the latest high and a declining trend line going through points 2-4. 

EUR/USD. ТF W1 (long-term), 29.12.13.
Published 29.12.2013 at 11.41 PM.

On these weeks with EUR/USD a bearish wolfe is formed. Also there was formed a ”falling star” model (still without approving). The enter is not about pips, sweet-zone is stretched up to 45th figure. I'm gonna enter in long-term trade with 1,4600 stop loss and 1,2050 take profit. At 1,2750 I'm planning to fix half of profit. Because it's the long-term the risk will be 20%.

May the profit be with you!